- Solar advice hub
- Solar-energy
- The top 19 solar energy statistics
The top 19 solar energy statistics
Here’s the state of the solar industry, through all the most important solar energy statistics for the UK and the world.


Why you can trust our content
We know that the solar industry is full of misinformation, but we only use reliable sources, including:
- Our experienced solar experts, installers and system designers
- Our own database of solar & battery system designs
- Authoritative bodies like MCS and the UK government


Calculate savings
What kind of home do you live in?
Calculate savings
What kind of home do you live in?
Solar energy statistics: at a glance
When you’re looking to buy solar panels, you want to know what you’re getting yourself into.
Solar energy has been around for more than a century, but has still only just begun its rise to global prominence.
Climate change and high energy bills have increasingly encouraged households and countries to turn to this cheap, renewable source of electricity, resulting in rapid growth.
In this ever-changing landscape, it’s crucial to keep up to date – so here’s the current state of the industry, through all the most important solar energy statistics for the UK and the world as a whole.
Find out how much you can save
What kind of home do you live in?
UK solar energy statistics
1. How much solar capacity is installed in the UK?
The UK has an installed solar capacity of more than 19 gigawatts (GW), as of August 2025, according to government data.
If we measure that figure in 4.5kWp solar installations, it's the equivalent of 4.2 million systems.
That’s a more than 18,000% increase since 2010, when the UK’s total solar capacity was just 0.0937GW.
Solar installations increased exponentially from 2010 onwards, when the government introduced the Feed-in Tariff (FiT) scheme to reward solar panel owners for the electricity they generated and exported.
The rate of installations slowed in 2016 – when the government massively cut the amounts paid to FiT recipients – and in 2019, when the government stopped the scheme.
However, elevated energy bills, more enthusiasm for green energy, and the introduction of smart export tariffs resulted in a big uptick in solar panel installations from 2021 onwards.
2. How many UK homes have solar panels?
More than 1.6 million homes in the UK have solar panels, according to the latest government data.
At the end of 2010, there were just 28,131 solar households. That’s a 5,600% increase in a decade and a half.
It took just three years to raise this number to 500,000, but another eight years after that to hit a million in 2021.
The rate of solar adoption has picked up since then, though.
Of course, solar panels aren't the only way for homes to shift away from the grid; check out our guide to the best ways to generate electricity at home.
3. How many people in the UK want solar panels?
Around two-thirds of adults in the UK want solar panels, according to the latest studies.
66% of people living in owner-occupied homes either have solar panels or will probably consider installing them in the next few years, the government’s 2023 survey showed.
This figure is very close to the 69% of people who would be ‘likely’ or ‘very likely’ to buy a home with solar panels on the roof, according to a 2023 survey by The Eco Experts.
People want solar panels, whether on their homes or local land, with 54% telling the 2023 government survey they'd be happy for a solar panel farm to be constructed in their area - compared to just 8% who'd be unhappy.
The proportion of people who want solar panels has stayed roughly stable since at least 2018, when a ClientEarth and YouGov survey found 69% either have or would like to install solar panels at home.
4. Which region has the most solar panels in the UK?
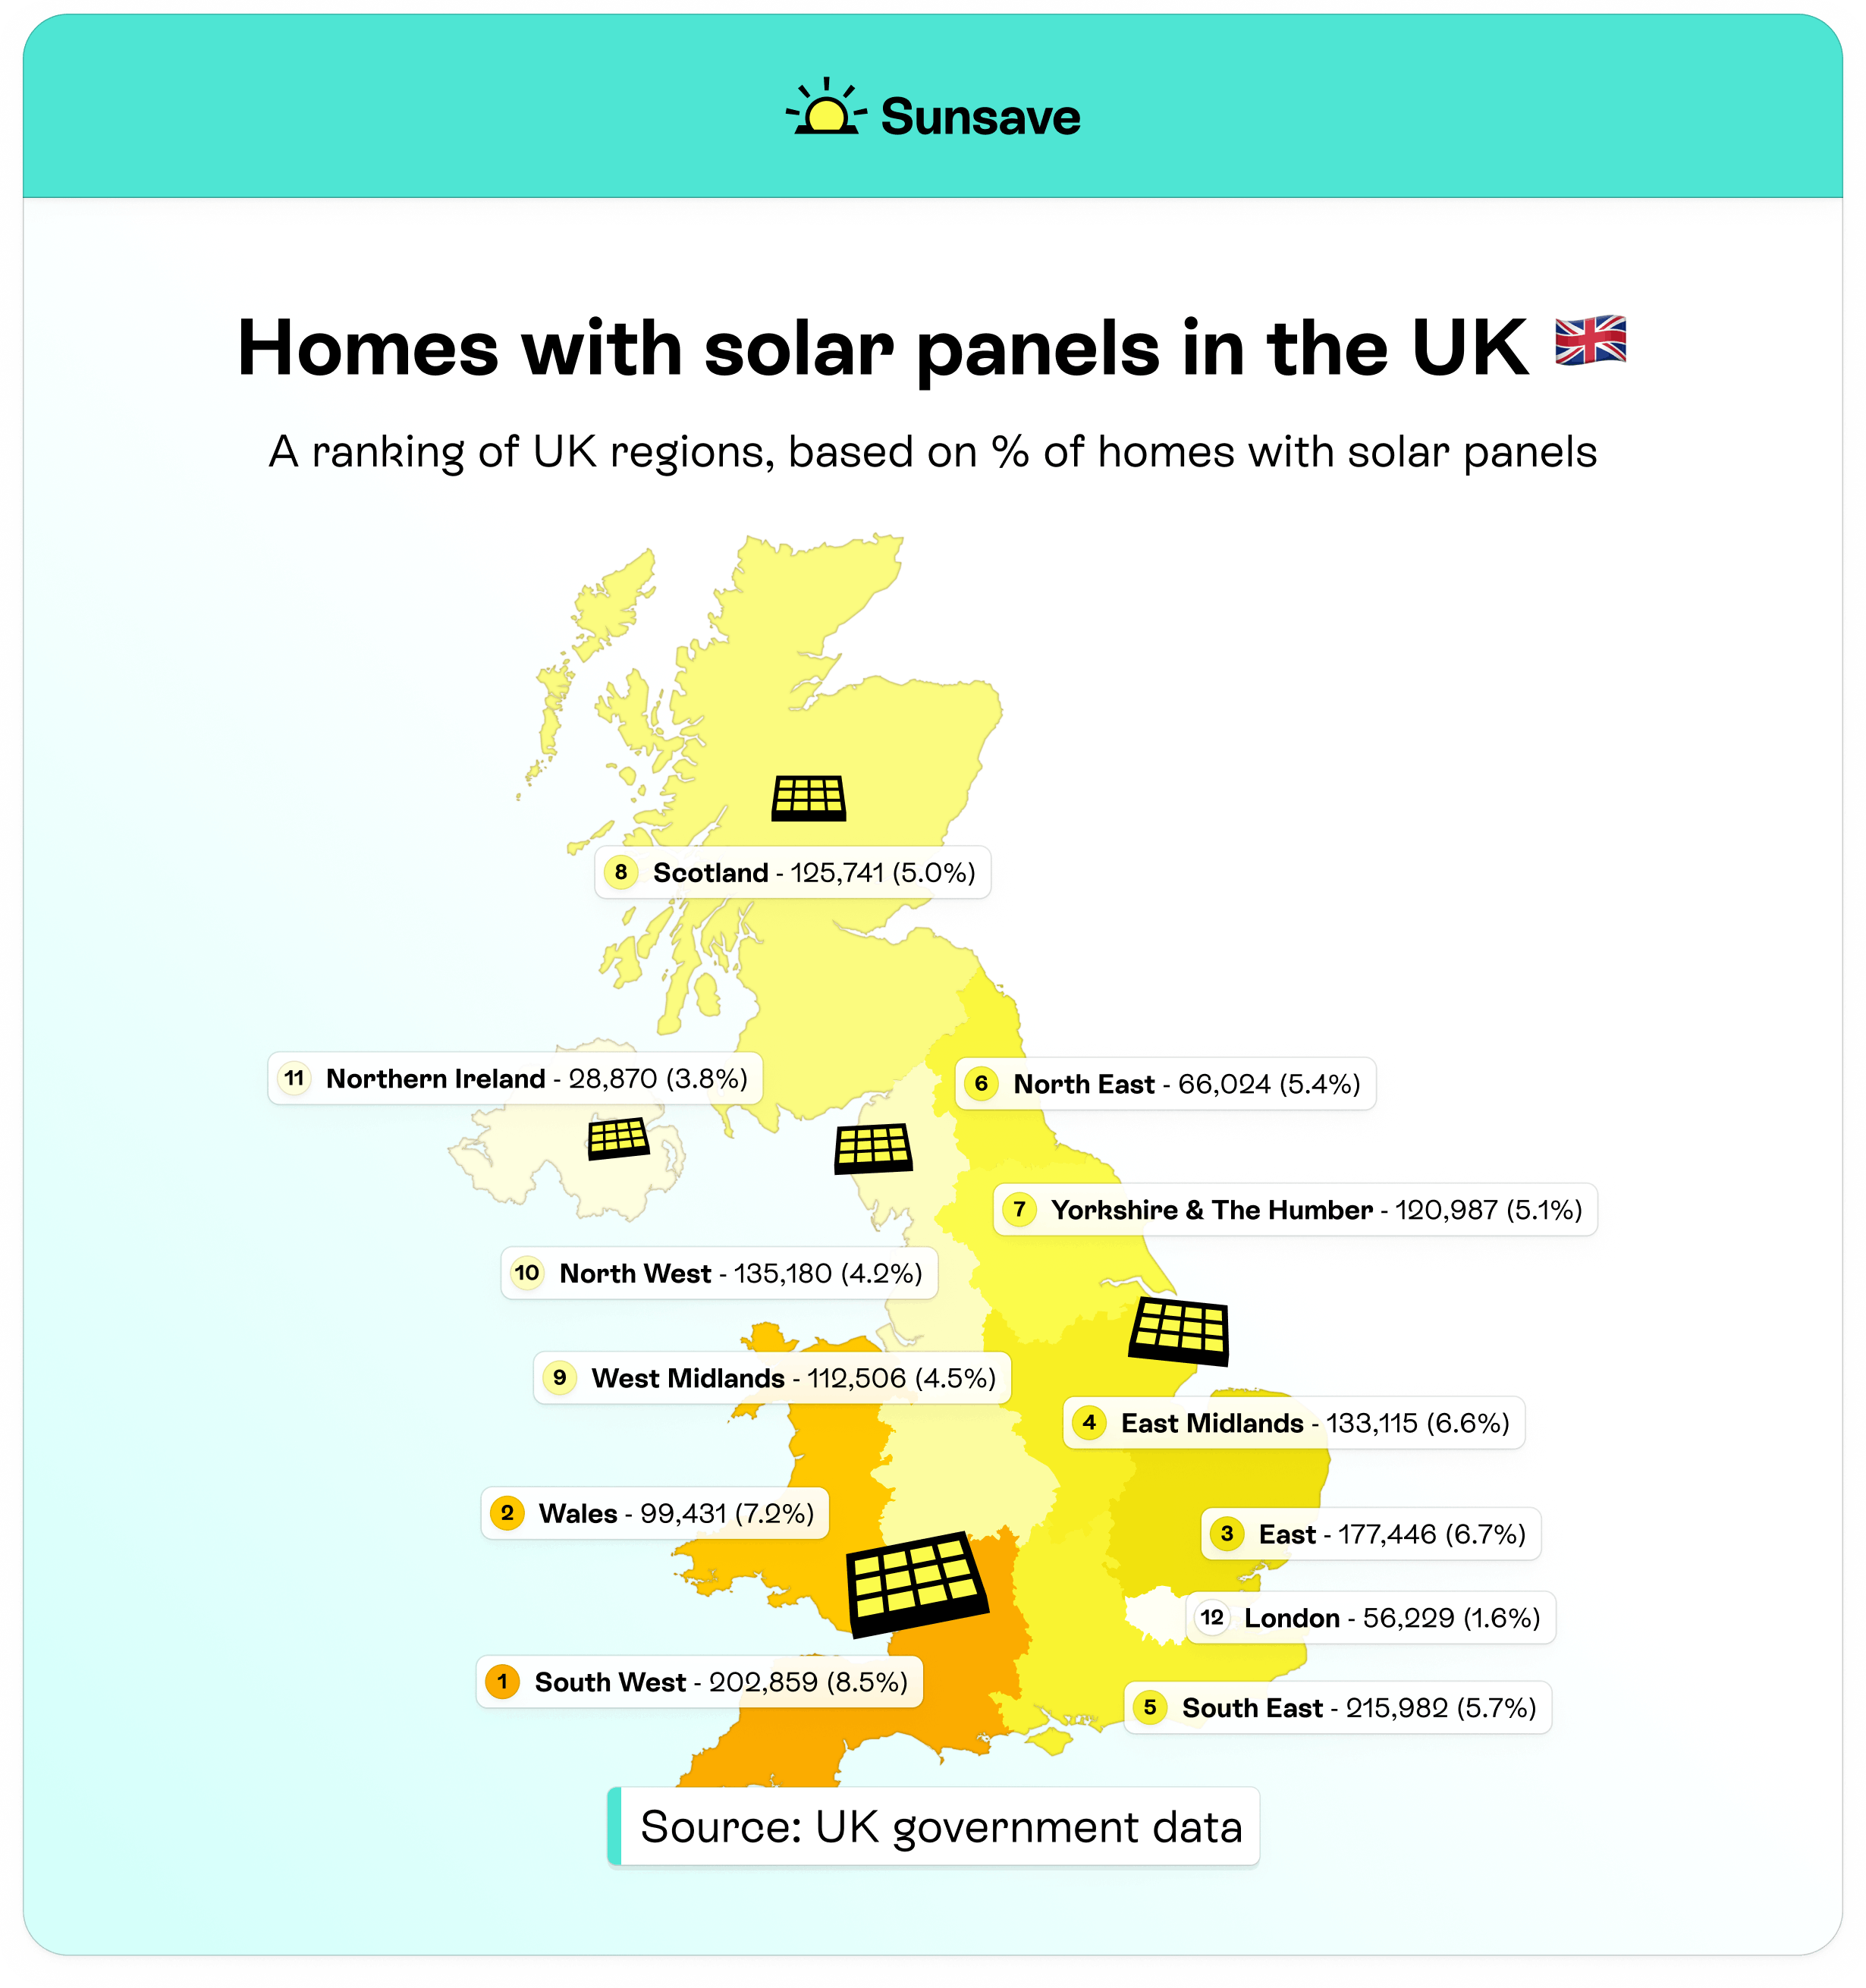
The South East region of England has the most solar panel installations in the UK for sheer volume, with a total of 215,982 as of March 2025.
With just 13,123 fewer installations, the English South West region is in second, followed by the East of England in third.
However, the South West tops the table when it comes to the percentage of households with solar panels, at 8.5%. Wales comes second on 7.2%, with the East of England placing third on 6.7%.

5. How have solar panel costs changed in the UK?
The inflation-adjusted cost of solar panels in the UK has fallen by 25% since 2013/14, according to government reports and our calculations.
However, this hasn’t been a steady decline. The average cost of the 0-4 kWp installations you’ll typically see on domestic properties reached its lowest point in 2020/21, and has since risen sharply, both in actual and inflation-adjusted terms.
As long as the cost of living remains high, solar panel prices are likely to keep increasing.
6. What % of the national grid is solar energy?
4.9% of the electricity that runs through the national grid is solar energy, as of 2023.
Solar energy entered the UK's electricity mix in any significant way for the first time in 1984, though still with less than 0.01% of the total.
Its contribution didn’t rise above 0.01% until 2011, when it hit 0.06% – and from that point, it took off.
Solar energy increased its share 19-fold over the next three years, to 1.13% in 2014, and has more than quadrupled that percentage in the years since.
7. What % of the UK’s renewable energy is solar?
3.38% of the UK’s renewable energy is solar, according to the government’s 2023 report.
When you consider solar made up less than 0.1% of all the UK’s energy in 2010, that’s a rapid rise.
Solar’s percentage is now at the same level as heat pumps, and more than double that of hydro.
8. How many people work in solar energy in the UK?
7,880 people work in solar energy in the UK, according to the Association for Renewable Energy and Clean Technology’s (REA) 2023 report.
Solar employees make up 5.6% of the 140,760 people who work in the UK’s renewable energy industry.
9. How many solar panels does the UK produce?
GB-Sol is the only company in the UK that manufactures solar panels entirely in the UK, but it only offers integrated solutions (such as in-roof solar panels and solar tiles).
This means some of your old roof tiles will need to be removed to accommodate the panels.
The number of solar panels produced by the Cardiff-based company is a drop in the ocean of the 161,494 systems installed in 2023 in the UK. This means the vast majority of UK installations in 2023 used solar panels made in other countries, especially China.
Find out how much you can save
What kind of home do you live in?
Global solar energy statistics
10. Which country produces the most solar panels?
China produces the most solar panels.
In 2022, the Asian behemoth manufactured 77.8% of all solar modules in the world, with a total capacity of 294.7GW – more than the world had installed in 2015.
This dwarfed every other country’s contribution. Vietnam came second by producing 24.1GW of panels – a relatively small 6.4% of all manufactured models.
They’re followed by Malaysia on 2.8%, then India, South Korea, and the US, which all produce 1.9% of solar panels.
Global solar panel production by country
11. How much solar capacity is installed globally?
There’s 1,053.1GW of solar capacity installed globally, according to the International Renewable Energy Agency (IRENA).
We’ve come a long way since 2013, when the globe held just 140.5GW of solar capacity. Since then, our capacity has risen by 750%.
597.6GW of the world’s current solar capacity – or 57% – is installed in Asia, mostly in China, Japan, and South Korea.
The UK’s capacity makes up just 1.6% of the total solar capacity on Earth.
To learn more, check out our rundown of the 13 countries that use the most solar energy.
12. What % of global electricity generation comes from solar?
4.5% of global electricity generation comes from solar, according to the International Energy Agency (IEA).
This percentage has exploded since 2008, when solar panels first reached 0.1% of global electricity generation, and even since 2015, when solar first reached 1%.
The IEA has predicted that solar will comprise 12.6% of worldwide electricity production by 2028, overtaking wind in the process.
13. What % of the world’s renewable energy is solar?
15.3% of the world’s renewable energy is solar, according to the IEA.
Solar panels produce more energy than any renewable source, bar wind and hydropower.
In 2008, solar’s proportion of all renewable energy just stood at 0.5%, and even as recently as 2016, it was only 5.5%.
The IEA has forecasted that solar will be 30.3% of all renewable energy in 2028 – nearly double its current proportion.
To learn about which countries are leading the way in renewable electricity generation, check out our rundown of renewable energy facts.
14. How many homes have solar panels around the world?
Around 25 million households have solar panels around the world, according to the IEA.
These installations generate a peak output of 130GW – which is 12.3% of the total global capacity.
There will be 100 million homes with solar panels by 2030, the IEA has forecasted.
15. Which country has the most solar panels?
China has the most solar panels, with a total capacity of 393GW.
That’s 37.3% of global capacity.
The US sits in a distant second place, with 113GW, which is 10.7% of the world’s capacity.
In 2013, China barely had the biggest solar capacity in Asia, and Germany had the most solar panels of any country, boasting 36.7GW – 26% of the Earth’s capacity at the time.
Africa’s solar capacity has increased by 1,770% since 2013, and the Middle East has expanded its capacity by 2,040%.
But it’s South America that truly stands out, having grown its capacity by an incredible 16,550%, from 0.2GW to 32.8GW.
16. How many solar panels does the world produce?
379GW of solar panels were produced in 2022, a 57% increase on 2021’s figure, according to a 2023 report by the IEA.
Solar panel production is generally measured in gigawatts, not number of panels, but if we roughly assume 250-watt solar panels are the global average, that means 1.5 billion solar panels are made per year.
And that number’s only going up.
To learn more, check out our guide to where solar panels are made.
17. How many people work in solar energy around the world?
3.9 million people work in solar energy across the world, according to a 2023 report by the IEA.
This is a 13% rise from the previous year, when 3.4 million were employed – and that’s a 13% increase from 2019, which shows how the solar industry is constantly growing.
77% of these jobs are located in China, which makes sense, since it’s the leading superpower in the solar industry.
18. How many solar panels are required to power the world?
It would take 114.6 trillion solar panels to meet the world’s electricity demand each year.
The current global demand for electricity stands at 28,661 Terawatt hours (TWh) per year.
If we use 250-watt panels, and estimate that solar installations will typically generate electricity at their given power rating, we get to our total.
At the present rate of production, it would take the world 76,430 years to make enough solar panels to generate all the electricity it needs – so clearly, we have to make more panels, more quickly.
19. How many solar panels are recycled around the world?
Hundreds of thousands of solar panels are recycled around the world every year – but this number will soon increase sharply.
The number of solar panels being installed 25+ years ago was low, so the solar recycling industry hasn’t yet reached its peak.
In the next decade, it’ll ramp up to meet demand, as millions of solar panels reach the end of their useful lifespan.
The Chinese government announced in 2023 that it was aiming to have a “basically mature” solar panel recycling system by 2030, when it estimated it’ll have to deal with 1.5 million tons of solar waste.
And European Union member countries are legally obligated to follow the Waste from Electrical and Electronic Equipment Directive, which compels them to recycle at least 80% of their solar panels.
The US is also taking big steps to increase its recycling rate, after languishing on 10% all too recently.
Summary
Now you know all the crucial statistics which show how far the UK and the world has come towards taking full advantage of the free, clean energy provided by the sun – and how far we have to go.
Solar energy has gone from having a negligible impact on global consumption to being a major player in the industry – and the best is yet to come.
With energy bills staying high, the existential need to reach net-zero carbon emissions only becoming more urgent, and demand for energy growing every year, we have to rapidly increase our green electricity capacity.
Solar energy will have a massive part to play in this future, as we electrify the world.
Find out how much you can save
What kind of home do you live in?
Related articles

Written byJosh Jackman
Josh has written about the rapid rise of home solar for the past six years. His data-driven work has been featured in United Nations and World Health Organisation documents, as well as publications including The Eco Experts, Financial Times, The Independent, The Telegraph, The Times, and The Sun. Josh has also been interviewed as a renewables expert on BBC One’s Rip-Off Britain, ITV1’s Tonight show, and BBC Radio 4 and 5.


